Climate projections play a crucial role in anticipating the impacts of climate change.
Climate projections are increasingly used to anticipate the impacts of climate change on territories, infrastructure and economic activities. However, one methodological question remains essential:
At what spatial resolution does climate data become truly useful for climate risk assessment?
Global climate models, particularly those from the CMIP6 ensemble used in IPCC assessments, simulate climate change at the planetary scale. They are essential for representing the major dynamics of the climate system and projecting their evolution under different emissions scenarios. However, their spatial resolution, often around 100 to 200 km, limits their direct application to detailed territorial assessments.
At this scale, a single grid cell may encompass a valley floor, a plateau, an urban area and several river basins. Local climate contrasts are therefore smoothed out or even obscured. Yet these contrasts can play a decisive role in determining the exposure of territories and infrastructure to climate hazards.
The impact of spatial resolution goes beyond how climate data is displayed on a map. It directly influences how climate phenomena are characterised.
At coarse spatial resolutions, several processes may be insufficiently represented:

Figure 1: Example of global-scale climate representation – mean temperature.
These limitations become particularly important when climate data is used to compare potential development sites, assess the exposure of infrastructure networks or identify territories requiring more detailed climate adaptation studies.
The challenge is therefore not only to produce reliable climate projections, but also to make them actionable at the scale at which decisions are made.
Climate downscaling aims to produce higher-resolution climate information from large-scale climate projections.
Its purpose is not simply to increase the number of pixels on a map, but to better represent geographical features and local climate variations.
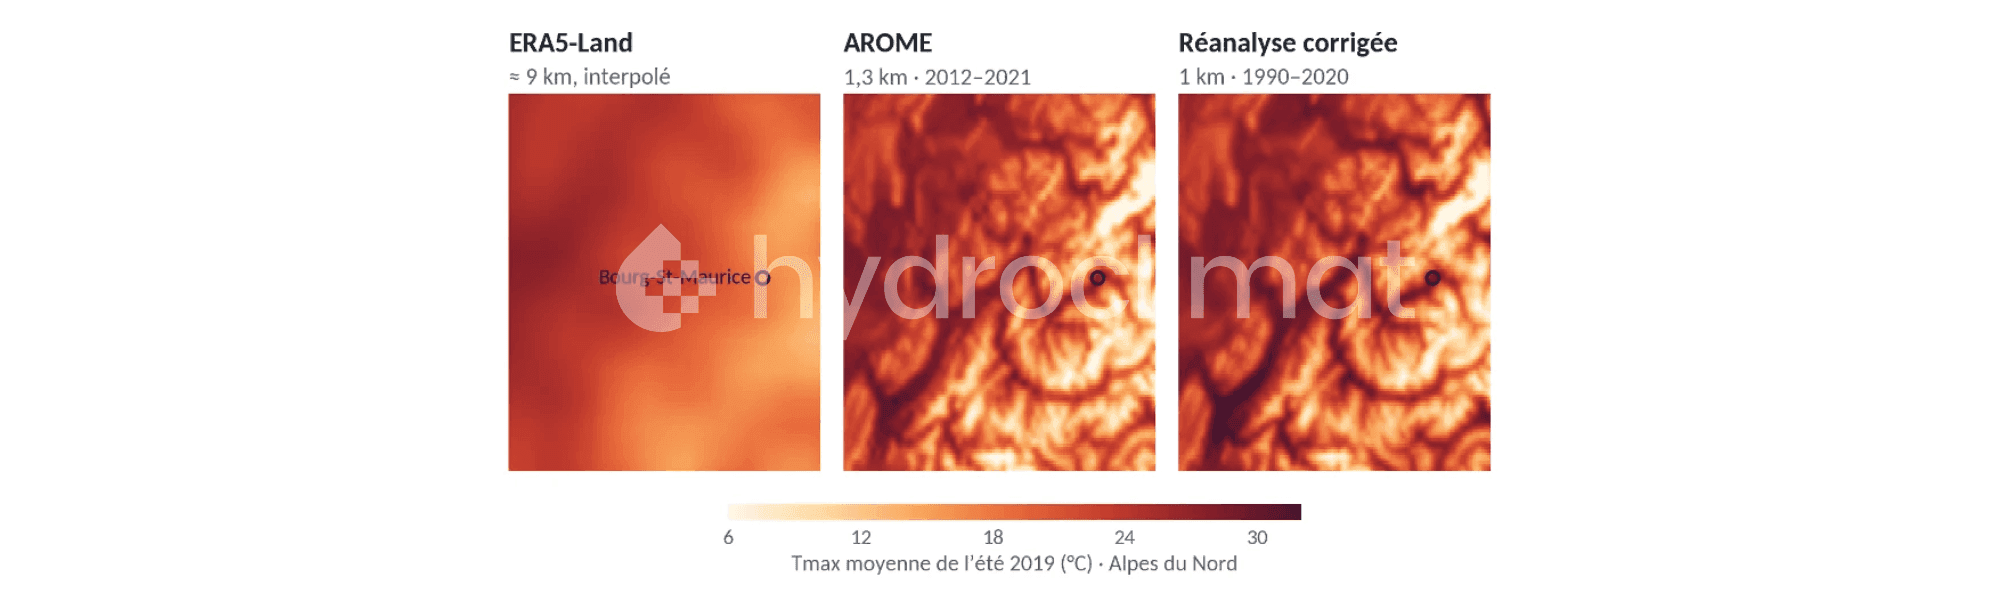
At 9 km resolution, broad regional patterns and certain topographical effects become more visible. However, some climate contrasts may still be smoothed out, particularly in mountainous regions, valleys and coastal areas.
At 1 km resolution, spatial representation becomes more detailed, allowing climate conditions within the same territory to be better differentiated, provided that the methods used can accurately reproduce these variations.
In the Alps, for example, a 9 km dataset may smooth out differences between valley floors and surrounding mountains. At 1 km, temperature gradients associated with topography can be represented in greater detail.

Figure 2: Comparison of summer maximum temperatures in the Northern Alps using three datasets: ERA5-Land, AROME and a bias-corrected 1 km reanalysis developed by Hydroclimat.
This comparison illustrates the value of a finer representation of topography-related temperature contrasts, as well as the importance of the correction methods applied.
Increasing spatial resolution does not, in itself, guarantee an improvement in the scientific quality of climate data. The robustness of the results also depends on the reference datasets, correction methods and validation procedures used.
As part of its research across metropolitan France, Hydroclimat is developing a 1 km climate reanalysis by combining several complementary data sources:
The performance of the reanalysis is then evaluated against weather station observations across several meteorological variables. This assessment makes it possible to quantify differences between the generated datasets and observations, and to examine their geographical distribution, particularly in mountainous regions.
For maximum temperatures, the median bias evaluated at weather stations decreases from 1.09°C for ERA5-Land to 0.33°C for the bias-corrected reanalysis developed by Hydroclimat.
This result highlights the importance of combining fine spatial resolution, high-quality reference datasets and statistical bias correction to produce relevant climate information at the local scale.
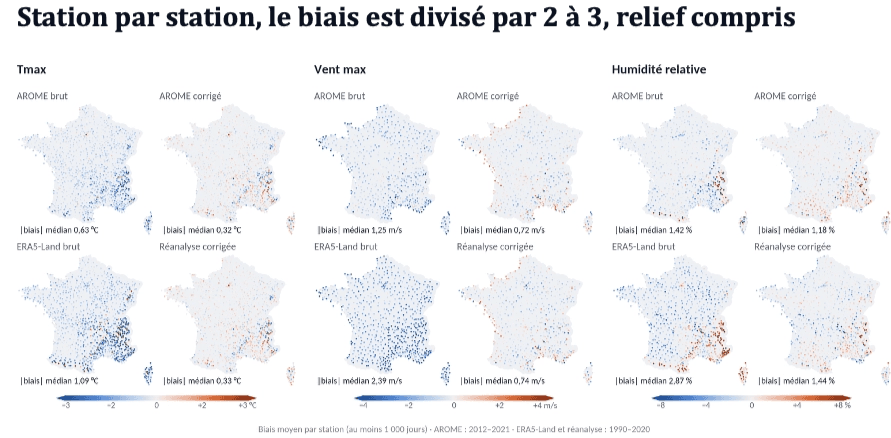
Figure 3: Comparison of biases in maximum temperatures, maximum wind speeds and relative humidity before and after bias correction of AROME and ERA5-Land data.
These results confirm the value of combining fine spatial resolution with rigorous correction and validation methods. The 1 km reanalysis is therefore distinguished not only by its level of spatial detail, but also by its measured improvement in agreement with observations.
Developing a high-resolution historical climate reference dataset is a first step. To analyse future climate conditions, it is then necessary to translate the changes simulated by global climate models to this finer scale while preserving the consistency of the climate change signal.
This approach presents specific methodological challenges for extreme events, whose spatial and temporal characteristics can differ significantly from average climate conditions.
Although climate averages help characterise broad climate trends, they are not always sufficient to assess events that may have the greatest consequences for territories and infrastructure.
This is particularly true for extreme precipitation. Its spatial and temporal variability can be substantial, with rainfall accumulations differing considerably over just a few kilometres and relatively short periods.
Coarse spatial resolution can smooth out these local maxima and limit the characterisation of the most intense events.
Climate downscaling must therefore pay particular attention to the statistical distributions of climate variables, including events located at the extremes of these distributions.
Hydroclimat is developing precipitation datasets at 1 km spatial resolution with a three-hourly time step across France, covering both the reference climate and different levels of global warming.
These analyses focus in particular on conditions corresponding to +1.5°C, +2°C and +3°C of global warming.
These datasets make it possible to study changes in the characteristics of extreme rainfall events and provide input data for further hydrological or hydraulic assessments.
High-resolution climate data, combined with a rigorous methodology, can support several operational applications:
Global climate models remain essential for understanding large-scale changes in the climate system.
Downscaling methods, combined with observations and statistical processing, help translate these changes into information that can be more directly applied to territorial assessments.
However, it is important to distinguish between climate hazard characterisation and a comprehensive risk assessment, which also requires consideration of exposure, vulnerability and, depending on the phenomenon being studied, additional modelling.
The objective is not to produce climate data at increasingly fine resolutions, but to provide information suited to the phenomena being studied and the decisions to be made.
Coarse spatial resolution may conceal significant territorial differences. Conversely, kilometre-scale data developed and validated using rigorous scientific methods can improve the characterisation of local and future climate conditions.
Through its research and development activities, Hydroclimat helps bridge the gap between global climate projections and the operational needs of territories, infrastructure operators and businesses.
From 200 km to 1 km, the challenge is not simply to increase spatial resolution, but to produce sufficiently robust climate information to support today's decisions and anticipate tomorrow's risks.
Sources: CMIP6, Copernicus ERA5-Land, Météo-France AROME and weather station observations. Hydroclimat research and development activities.
High-resolution climate data describes climate conditions at a fine spatial scale, such as 1 km. It helps capture local climate variability associated with topography, coastal influences and geographical characteristics, supporting more detailed assessments of climate hazards and regional differences.
The main difference lies in spatial detail. At 9 km resolution, local climate variations may be smoothed out, particularly in mountainous or coastal regions. At 1 km, temperature gradients and precipitation patterns can be represented in greater detail, provided that appropriate downscaling, bias correction and validation methods are applied.
Climate projections at 1 km resolution provide more detailed information about local climate hazards and their potential evolution. They can help identify spatial differences in climate exposure, compare potential development sites and support further analyses of future climate conditions affecting infrastructure and territories.
No. Higher spatial resolution does not automatically guarantee greater scientific accuracy. Data reliability also depends on the quality of reference datasets, statistical bias correction methods and validation procedures. Comparing results with meteorological observations is essential to assess performance and identify systematic errors.
Climate downscaling refers to methods used to translate large-scale climate model outputs into higher-resolution climate information. It aims to better represent regional and local climate characteristics, making climate projections more suitable for territorial assessments, infrastructure planning and climate risk analysis.
The appropriate spatial resolution depends on the climate hazards being studied, the geographical scale and the decisions involved. Regional datasets may be sufficient for broad assessments, while site-specific studies and infrastructure planning often benefit from kilometre-scale climate information. Additional modelling may be required to assess certain hazards and their impacts.
New CMIP7 scenarios: what climate futures can we expect by 2100?
9/21/2026
Soil drought: where does summer 2026 really stand?
9/10/2026
Adapting Regional Transport Networks to Climate Change: From Assessment to Action
9/3/2026

Data center: integrating future climate into site selection
8/24/2026
How much will climate risk really cost?
6/29/2026
