How can climate risk be compared objectively across France, Brazil and India?
Today, access to climate data is no longer the main challenge. Organisations now have access to climate projections covering the entire globe and describing the future evolution of a wide range of climate hazards. The challenge now lies in interpreting this information.
How can the evolution of extreme rainfall be objectively compared across regions with very different climates? How can the most exposed areas be prioritised and their evolution tracked across different global warming levels?
To address these challenges, Hydroclimat has developed a global scoring methodology that transforms complex climate indicators into exposure levels that can be directly used for risk management.
This approach is based on three key principles:
The hazard is characterised using an indicator that describes the frequency of extreme rainfall days, defined relative to the 99th percentile of precipitation calculated over a reference period.
This type of indicator is widely used in climate extremes research because it focuses on the rarest events, which are also the most likely to generate significant impacts.
The indicator directly measures changes in the frequency of exceptional rainfall events under different Global Warming Levels (GWLs). It therefore makes it possible to assess the potential intensification of risks associated with heavy rainfall, pluvial flooding and hydraulic overflow.
For infrastructure operators, local authorities and the insurance sector, this information is strategic. Damage is not only driven by changes in average precipitation, but often by increases in the frequency or intensity of extreme events.
An analysis of global distributions reveals strong spatial variability. Most regions experience moderate changes, while a smaller number of areas concentrate the most significant increases. This statistical structure justifies the use of a distribution- and quantile-based approach, which is more robust than a simple linear classification.
One of the main strengths of the indicator lies in the way it is constructed. Extreme rainfall does not correspond to a universal threshold that can be applied everywhere in the world. An event considered exceptional in an arid region may be relatively common in a tropical climate. Directly comparing rainfall amounts between regions would therefore lead to misleading interpretations.
To account for this climatic diversity, the threshold corresponding to the 99th percentile of precipitation is calculated individually for each grid cell using its own reference climatology. Future projections are then compared against this local threshold.
Each region is therefore assessed relative to its own historical climate. The indicator does not measure the absolute amount of rainfall, but rather changes in the frequency of events considered locally extreme.
This approach makes it possible to detect climate changes that are specific to each region, regardless of its initial climatic conditions. An increase in the frequency of extreme rainfall can therefore be identified in tropical, temperate and semi-arid regions alike, provided it represents a significant change compared with local historical conditions.
The analysis therefore begins with a local interpretation of climate change. Comparisons between regions only take place during the normalisation step used to construct the global exposure score.
This distinction is essential. It preserves the climatic consistency of each region while making it possible to compare projected changes consistently at the international level. The final score therefore does not directly compare climates with one another, but rather compares the intensity of projected changes relative to the historical climate of each region.
One of the main challenges of climate indicators lies in their interpretation. The same raw change can have different meanings depending on the initial climate of a region. Conversely, a very large relative change may sometimes result from very low baseline values and, if interpreted on its own, may lead to an overestimation of the climate signal.
To avoid these biases, Hydroclimat uses a methodology that combines two complementary dimensions: the absolute magnitude of change and its relative significance compared with the reference situation.
The absolute change represents the primary signal. It identifies the regions where projected climate change is physically significant. The relative change complements this analysis by highlighting areas where the change is particularly important in relation to the initial climate.
This dual perspective makes it possible to compare regions with very different climates without relying solely on either raw values or percentage changes, which can sometimes be misleading.
The distributions are analysed at the global scale using all grid cells from the 10 km resolution global climate database. The scores are then constructed consistently across all global warming levels considered, ensuring stable and comparable results over time.
To facilitate the operational interpretation of the results, climate changes are converted into synthetic scores.
For hazards where an increase in the indicator directly reflects a higher level of risk, such as extreme rainfall, the exposure score is expressed on a scale from 0 to 5.
The highest scores correspond to the most significant projected changes within the global distribution. A score of 0 indicates that no meaningful signal has been identified for the hazard under consideration, for example when the projected change is negligible, not statistically significant or does not correspond to an increase in risk.
This approach transforms complex climate information into an indicator that can be readily understood by non-specialist users.
A high score does not mean that a catastrophic event is expected to occur on a specific date. It indicates that the region is among those where the projected evolution of the hazard is the most significant relative to the global distribution.
To improve the robustness of the scoring methodology, additional consolidation rules are applied. These are designed in particular to prevent large relative changes, resulting from very low baseline values, from artificially producing high exposure scores when the underlying physical signal remains limited.
These safeguards are essential to produce scores that are clear, comparable and climatologically consistent.
Not all climate indicators should be interpreted according to the same risk intensification logic.
For some hazards, such as extreme rainfall and heatwaves, an increase in the indicator is generally associated with higher exposure. In these cases, a conventional exposure score provides an appropriate representation of the magnitude of the projected change.
Other indicators primarily describe changes in the climate regime itself. This is particularly true for many precipitation indicators, where both increases and decreases may represent important information depending on the sector and the region concerned.
For these situations, Hydroclimat uses a signed score expressed on a scale from -5 to +5.
This representation preserves information about the direction of climate change while also quantifying its magnitude.
It is particularly useful for analysing changes in total precipitation, seasonal contrasts and shifts in hydrological regimes across different regions.
Unlike an exposure score, a signed score does not directly represent a level of risk. Instead, it describes the nature of the observed change: a decrease, relative stability or an increase. Its interpretation therefore depends on the context in which it is used, whether for water resource management, agriculture, infrastructure planning or climate adaptation.
This distinction makes it possible to maintain a consistent scoring methodology while respecting the physical meaning of each climate indicator.
Hydroclimat's scoring methodology is based on a common framework applied across all climate indicators. This approach ensures the consistency of the analyses and the comparability of the results at the global scale.
However, not all hazards should be interpreted in the same way. The relationship between changes in an indicator and changes in risk depends on the physical nature of the phenomenon being analysed.
For certain hazards, such as extreme rainfall, heatwaves and wildfires, an increase in the indicator generally reflects greater exposure. In these cases, the scoring methodology primarily relies on analysing the projected changes between the reference period and the different global warming levels.
Other hazards require a different interpretation. Cold-related hazards, for example, are often better characterised by their absolute values than by their projected evolution. In these cases, a decrease in the indicator may correspond to a reduction in risk rather than an increase.
The construction of the score must therefore take into account the physical meaning of each indicator in order to avoid automatic interpretations or misleading comparisons.
This approach makes it possible to maintain a consistent methodology while ensuring that each score accurately reflects the underlying climate reality and the associated level of exposure.
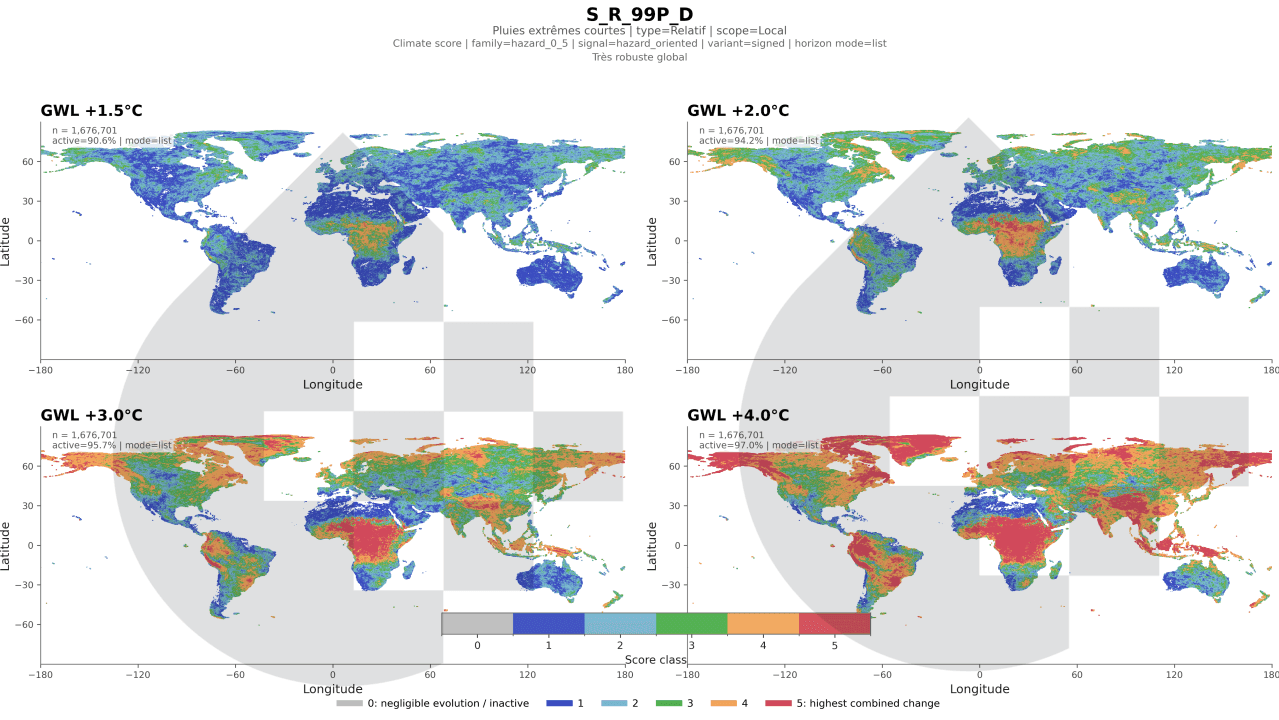
Applying this methodology across the globe makes it possible to generate consistent high-resolution maps. Each 10 km grid cell is assigned an exposure class calculated using the same methodological principles, regardless of the continent.
The resulting maps provide an immediate overview of the regions where changes in extreme rainfall are projected to be the most significant as a consequence of climate change.
This representation makes it easier to identify climate hotspots, analyse asset portfolios distributed across multiple countries and compare international portfolios.
It also makes it possible to monitor changes in exposure across different global warming levels while maintaining a stable methodological reference. For signed indicators, it additionally highlights regions where the climate regime is shifting towards significantly wetter or drier conditions.
The objective of this approach is to transform a complex climate indicator into a tool that can be directly used for risk management.
The main advantage of the scoring methodology is that it makes climate information immediately actionable, whereas raw climate data often remains difficult to interpret.
An asset manager can quickly identify the regions where changes in extreme rainfall are the most significant, compare sites located in very different climate zones and directly integrate this information into prioritisation and investment processes.
The methodology also facilitates the development of consistent multi-hazard analyses at the global scale, as well as climate reporting for a wide range of stakeholders.
Beyond extreme rainfall alone, this methodology provides a fundamental building block for developing multi-hazard indicators that combine droughts, heatwaves, cold events and wildfires. It also makes it possible to represent changes in climate regimes, such as increases or decreases in precipitation, in a format that is directly understandable for operational users.
This methodology is integrated into Hydroclimat's databases and analytical tools. It will be available worldwide at 10 km spatial resolution, directly through the Argos platform and Hydroclimat's climate data services.
In practice, users will be able to instantly access standardised exposure levels, compare assets located in different countries and integrate this information directly into their analytical, risk management and decision-support tools.
The methodology combines two complementary levels of analysis. First, each region is assessed relative to its own climatology in order to measure local changes in climate hazards. Second, a global normalisation framework makes it possible to compare regions objectively using a common statistical reference.
Where relevant, the methodology also preserves the direction of climate change through the use of signed scores, making it possible to distinguish between increasing, decreasing and relatively stable climate indicators.
This dual approach provides a robust framework for analysing and comparing climate risks at large scales while preserving the specific climatic characteristics of each region.
Beyond extreme rainfall, this methodology provides a fundamental building block for the development of multi-hazard indicators and operational climate services at the global scale.
At a time when investment, planning and adaptation decisions increasingly require a forward-looking view of climate change, the ability to transform complex data into indicators that are comparable, understandable and directly actionable has become a critical challenge.
The objective is no longer simply to produce climate data, but to deliver robust, consistent and immediately actionable information that supports better decision-making.
Yes. Hydroclimat's methodology is based on a global normalisation framework that enables objective comparisons between sites located in very different climate contexts, while accounting for the local climatic characteristics of each region.
New CMIP7 scenarios: what climate futures can we expect by 2100?
9/21/2026
Soil drought: where does summer 2026 really stand?
9/10/2026
Adapting Regional Transport Networks to Climate Change: From Assessment to Action
9/3/2026

Data center: integrating future climate into site selection
8/24/2026
How much will climate risk really cost?
6/29/2026
