Climate Change Data
We provide high value climate data adapted to the assessment of physical climate risk to ensure the resilience of your activities.
what is climate change data?
Climate change data covers all the atmospheric data used to analyse, understand and predict climate change on different spatial and temporal scales. It includes variables such as air temperature, precipitation, relative humidity and wind speed, from which climate indicators are generated.
Why request climate change data?
‘There is not a single place in France, not a single French person, that is not directly or indirectly affected by climate change. Solutions exist to help us adapt, and they need to be deployed now’. Agnès Pannier-Runacher, French Minister for Ecological Transition, presenting the latest version of the National Climate Change Adaptation Plan (PNACC) for 2025.
Climate change data is essential for anticipating climate change, assessing risks and guiding adaptation strategies. By relying on accurate data and reliable indicators, public and private players can better understand the impact of climate phenomena on their activities and infrastructures.
Access to qualified climate change data is a key lever for anticipating and mitigating the impacts of climate change, in a context where every structure or territory is exposed to physical climate risk.


Climate change data: essential information for every sector
Urban planning and infrastructure: integrating climate projections helps to design cities that are resilient in the face of heat waves, flooding and rising sea levels. For example, modelling urban heat islands helps to adapt development plans.
Energy: using climate change data, we can better anticipate the availability of resources (hydroelectricity, solar and wind power) and adapt infrastructures to the temperature variations that influence energy demand.
Insurance and finance: climate risk models, based on data on extreme rainfall, drought or storms, can be used to refine strategies for assessing and pricing climate-related claims.
Agriculture and water resources: thanks to projections of rainfall patterns and water availability, farmers and catchment managers can adapt their practices to ensure the sustainability of crops and the management of water resources.
Public health: by anticipating the development of heat waves or episodes of air pollution, the health authorities can better prevent the risks for the most vulnerable populations.
Thanks to climate change data, businesses and local authorities can put in place robust adaptation strategies tailored to their sector, guaranteeing greater resilience in the face of future climate challenges.

What is the basis for climate risk analysis?
Physical risk analysis is based on climate change data from which indicators are derived to represent a hazard. Climate indicators must be qualified by their spatial resolution and their reliability, especially if the risk of transition is subsequently assessed.
Physical climate risks include chronic changes (rising temperatures, changes in precipitation) and acute events (droughts, storms, intense precipitation). Any structure must integrate these risks to ensure its resilience.
Risk identification is based on an analysis of current and future climate hazards, and on an assessment of vulnerabilities. Access to qualified climate data is essential if climate projections are to be compared with local data.
Adaptation strategies involve urban planning, strengthening infrastructures and developing nature-based solutions. Finally, continuous monitoring of risk indicators enables adaptation measures to be adjusted and decisions to be optimised.
Anticipation, based on reliable climate change data, is key to limiting costs and strengthening resilience in the face of climate change.
Accurate climate change data, a major challenge for risk analysis
Climate risk analysis relies on indicators derived from climate data, which must be qualified by their spatial resolution and reliability. This precision is all the more crucial when the assessment of transition risk is included in the analyses. Climate change data must be qualified and processed before it can be incorporated into climate models.
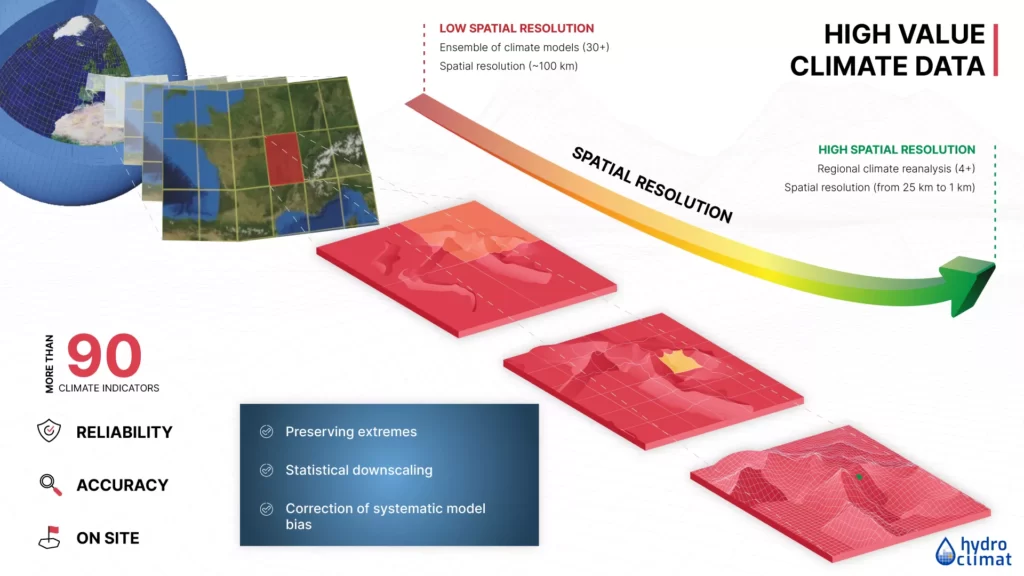
Current climate models, with a resolution of around 100 km, have inherent biases linked to their physical parameterisation. To refine these data, we are using alternative methods to generate qualified and corrected climate indicators.
We apply advanced univariate and multivariate bias correction techniques to adjust climate simulations while preserving the spatial and temporal consistency of climate variables. This approach guarantees a better representation of extreme events, both in terms of intensity and frequency.
High spatial resolution of climate change data thanks to machine learning
To refine the spatial resolution and improve the accuracy of climate projections, we are integrating advanced machine learning methods. These techniques help to reduce uncertainties, optimise the modelling of climatic phenomena and refine the analysis of local trends.
Thanks to these approaches, we are generating climate change data at very high resolution, down to 30 metres, offering unprecedented granularity. This increased precision enables a more detailed assessment of climate risks and facilitates the development of adaptation strategies tailored to local conditions.
Climate risk
There are four key components of physical climate risk to consider in any analysis:
Hazards refers to climate-related physical events or trends that may cause asset damage, social and economic disruption, even loss of life or environmental degradation. Hazards are characterized by their intensity and their probability of occurrence. Climate hazards have a direct impact on a site (infrastructure, crop plot, building, etc.), but the way in which climate hazards impact the site will vary depending on its geographical location as different regions exhibit distinct climate patterns.
It is possible to analyze and quantify how a site or a territory will be exposed to climate hazards. A climate hazard (e.g., heat waves) is physically represented by indicators (e.g., WSDI indicator — duration and frequency of heat waves) making it possible to assess in a quantified way whether the geographical space of your site is weakly, moderately, or strongly exposed to the climate hazards.
The sensitivity of a site to climate hazards depends on multiple socio-economic, physical, human, and environmental criteria. Assessing sensitivity is above all assessing whether the consequences of a hazard are potentially low, medium, high, or very high. This is based on the analysis of local expertise related to the intrinsic characteristics of the site. Take for example the “forest fire” hazard represented by the Weather Fire Indicator (IFM) index. The sensitivity of a specific site to the “forest fire” hazard will be high if the forest area is large and if flammable compounds are present on site.
Vulnerability is a function of sensitivity, adaptive capacity, and exposure to climate hazards. Adaptive capacity that is low, relative to exposure and sensitivity, contributes to high vulnerability. By contrast, higher adaptive capacity helps reduce the effects of exposure and sensitivity, and in turn reduces vulnerability. Hence, each site has its own level of physical vulnerability to climate change.
For who ?
The data we provide is intended for a wide range of players concerned by climate issues. In particular, we support :
- local and regional authorities, in their adaptation and sustainable planning initiatives;
- finance and insurance companies, for the assessment of physical risks in asset portfolios;
- Infrastructure managers and engineering firms, to integrate climate into the design and resilience of structures;
- farmers and the agri-food industry, to anticipate the impact on crops and resources;
- water management operators, faced with increasing hydrological variability.
Thanks to our expertise and up-to-date, qualified climate datasets, we enable each player to assess their vulnerabilities, build robust strategies and comply with regulatory frameworks, while boosting the economic performance of their business.
How ?

What we offer
Various variables and spatial resolution
TRACC (FR)
CSRD (EU) / EU taxonomy
Made to measure
Impact of a climate indicator on a defined environment
Advantages
The benefits offered by our service
Flexible between 1971 and 2100
France, Europe and International
Flexible between 2025 and 2100
Flexible between 1971 and 2014
Up to 30 m or position of a site
SSP1-2.6 (+1.8°C), SSP2-4.5(+2.7°C), SSP3-7.0 (+3.9°C),SSP5-8.5 (+4.4°C)
Our user cases


