Flood Data
We provide high spatial resolution flood data suitable for flood risk assessment and mapping. The data give an indication of the spatial extent and probability of occurrence of climate change flood inundations.
What is flood data?
Flood data provides detailed information on the extent of flooded areas and the height of water at each point along a river, offering a precise understanding of the spatial extent of flooding, particularly in the context of climate change.


Why request flood data?
Qualified, ultra-precise flood data is essential for strengthening adaptation measures, mitigating flood impacts and increasing resilience. Flood data enables better quantification of risks and facilitates the implementation of effective strategies.
- According to the Caisse Centrale de Réassurance (CCR), the average annual cost of flooding could rise by 15% by 2050, representing an increase of 148 million euros per year. Taking into account the evolution of insured stakes, this increase could reach 38%, i.e. an additional 370 million euros per year. Access to accurate flood data is fundamental to limiting the cost of flood damage compensation.
- Cities and Metropolises – Urban planning: Integrating flood data into urban planning processes helps to avoid building in high-risk areas and to design buildings adapted to future climate hazards.
- Infrastructure – Adapting to climate change: Detailed flood hazard data helps plan resilient infrastructure and implement effective adaptation strategies.
- Local authorities – Flood zone mapping: Precise mapping of flood plains identifies areas likely to be flooded during events of varying magnitude, thus facilitating long-term risk management.
What is a flood inundation?
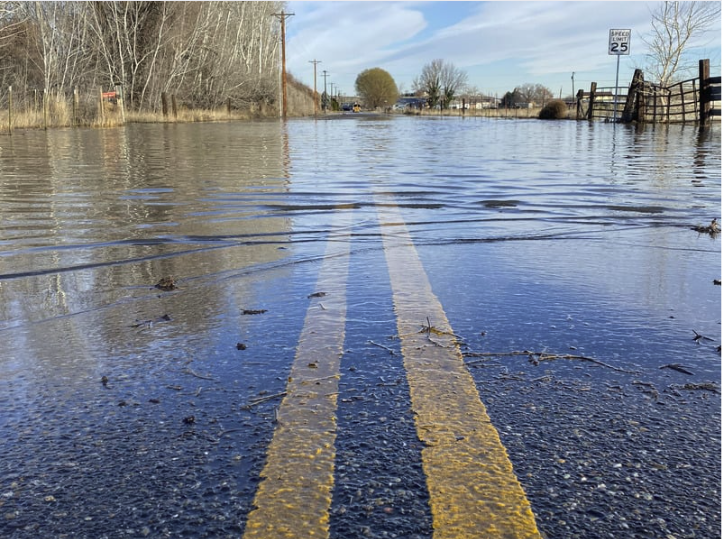
Flooding is the temporary submergence of areas usually out of water. There are 4 main types of flood:
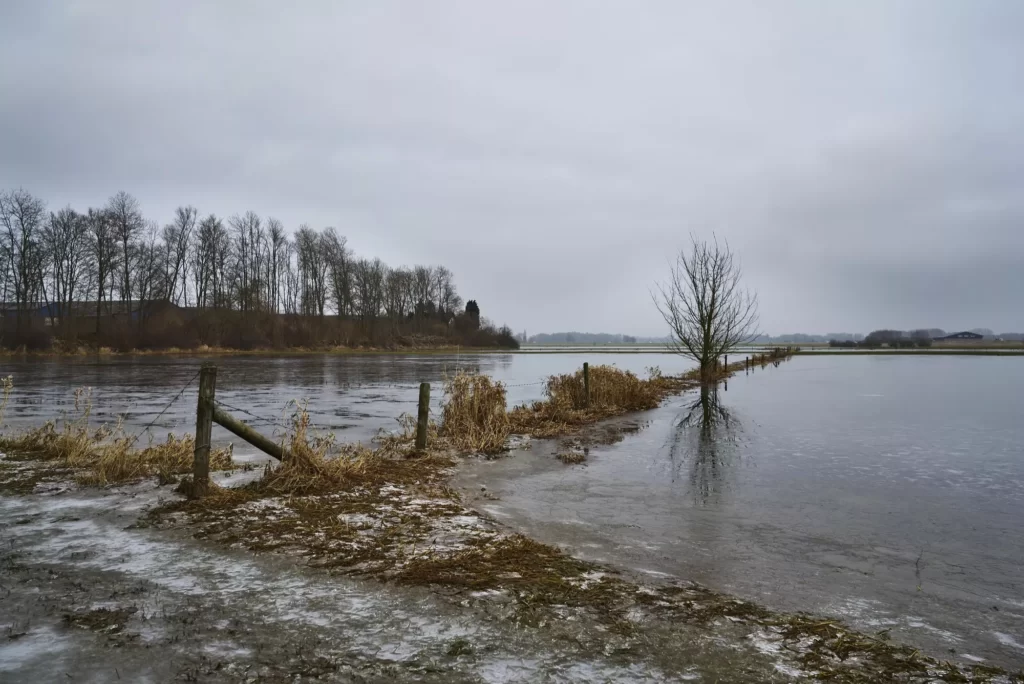
- River overflow: a flood can cause a river to burst its banks and flood the surrounding land. It is the most common flooding case.
- Urban runoff: during heavy rainfall in urban areas, water does not infiltrate the soil. caused by rainfall and impervious surfaces that overwhelm the capacity of drainage systems, such as storm sewers.
- Rising water table: in the event of prolonged rainfall, the water table rises, flooding surrounding areas.
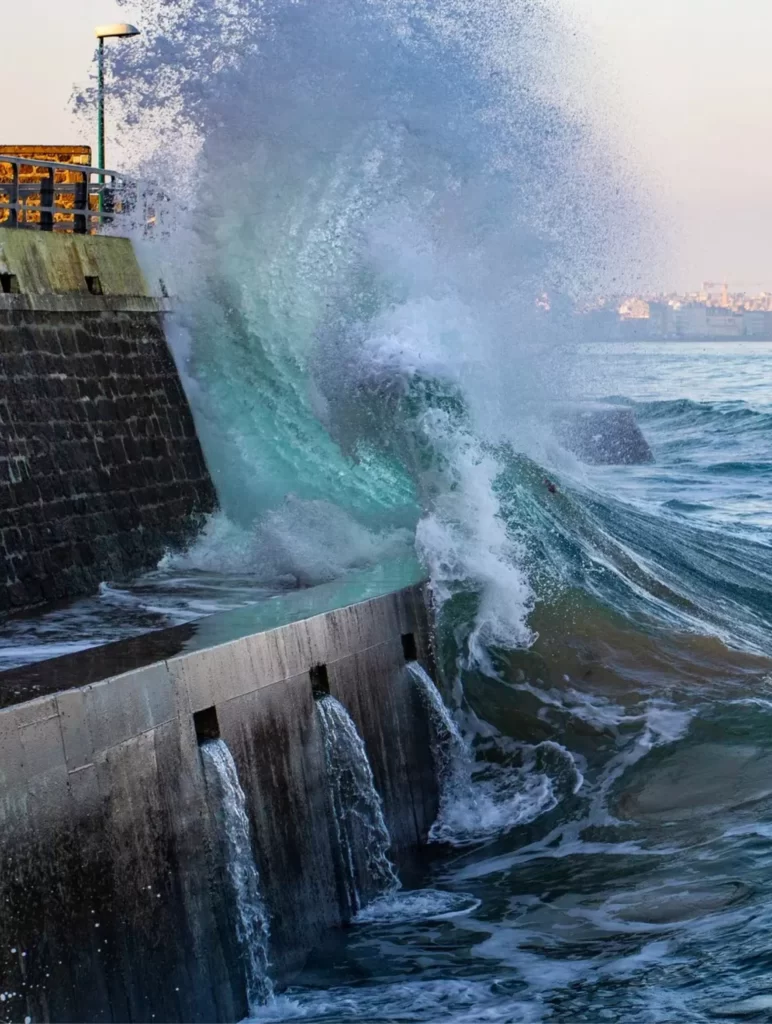
- Sea flooding: unfavorable weather and ocean conditions on the coast lead to a rise in sea level and flooding of coastal areas.
Understanding these different types of flooding is essential for implementing effective adaptation measures, minimizing the impact on people and infrastructure.

Flooding, a major risk
First natural risk in Europe by the number of exposed people and the damage they cause, floods affect all countries.
“Flooding is the main natural hazard in France, accounting for 50% of the compensation paid by insurers for natural disasters (CAT-NAT) over the past 20 years, i.e. 24.8 billion euros.”
Climate change will bring more frequent floods across Europe, posing a threat to human safety, homes, businesses, and infrastructures.
What is flood risk ?
Flood risk is a combination of the probability (occurrence) of an event occurring and the consequences (impact) should it occur. Flood risk depends on the existence of a source of flooding, such as a river, a route taken by floodwater (path) and an element affected by flooding, such as infrastructure. Return periods are used to describe the frequency with which a flood event will occur. Return periods are an average of the frequency with which a flooding event of a given magnitude will occur, and therefore the probability or risk of flooding occurring.
For example, a flood with a return period of 100 years has a 20% probability of occurring in 2040, with a 30% increase in submerged surfaces.
How do we model flood zones?
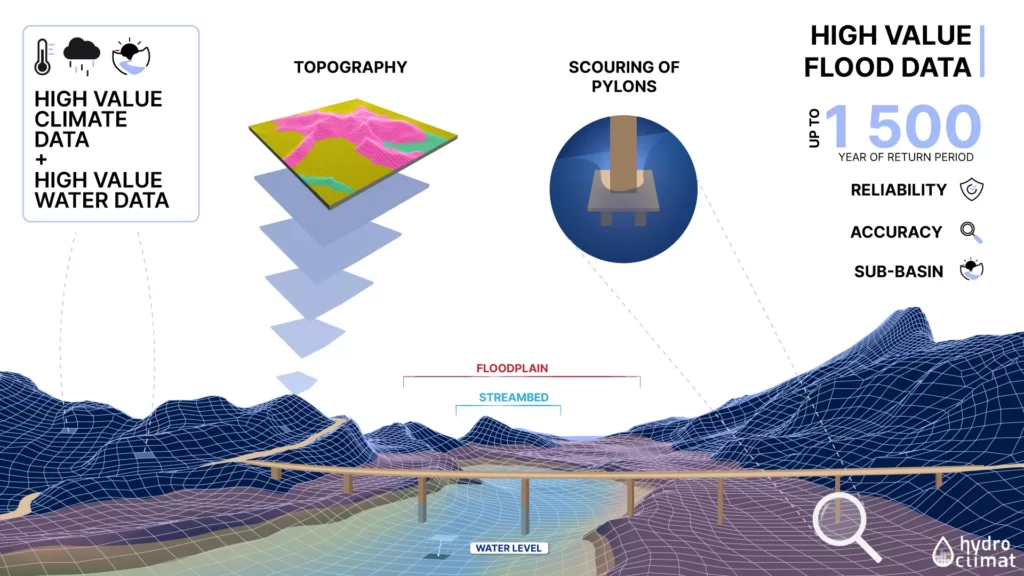
To produce a flood mapping model it is essential to have detailed climate change and water resource data , as well as precise information on topography and channel characteristics influencing flood wave propagation. Thanks to our in-house expertise in 1D/2D digital hydraulic modeling, we are able to produce high-resolution spatial simulations and projections of flood areas for different return periods, both in France and abroad.
For who ?
The data we provide is intended for a wide range of players concerned by climate issues. In particular, we support :
- local and regional authorities, in their adaptation and sustainable planning initiatives;
- Finance and insurance companies, for the assessment of physical risks in asset portfolios;
- Infrastructure managers and engineering firms, to integrate climate into the design and resilience of structures;
- farmers and the agri-food industry, to anticipate the impact on crops and resources;
- water management operators, faced with increasing hydrological variability.
Thanks to our expertise and up-to-date, qualified climate datasets, we enable each player to assess their vulnerabilities, build robust strategies and comply with regulatory frameworks, while boosting the economic performance of their business.
How ?

What we offer
Various variables
TRACC (FR) CSRD (EU) / EU taxonomy Dimensioning
Impact d’un indicateur hydraulique sur un environnement défini
Advantages
Projections at the catchment
Up to 30 m
futures horizons
Flexible between 2025 and 2100
reference periods
Flexible between 1971 and 2014
Geographical coverage
France, Europe and International
climate scenarios
SSP1-2.6 (+1.8°), SSP2- 4.5 (+2.7°C), SSP3-7.0 (+3.9°C), SSP5-8.5 (+4.4°C)
Our user cases

