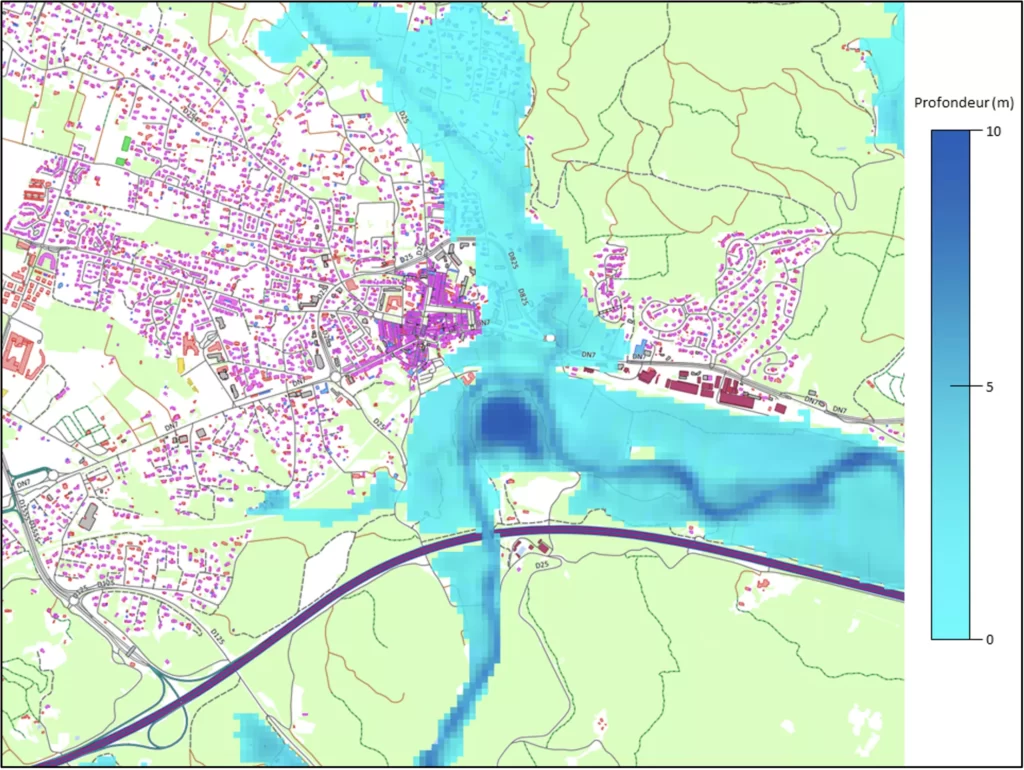
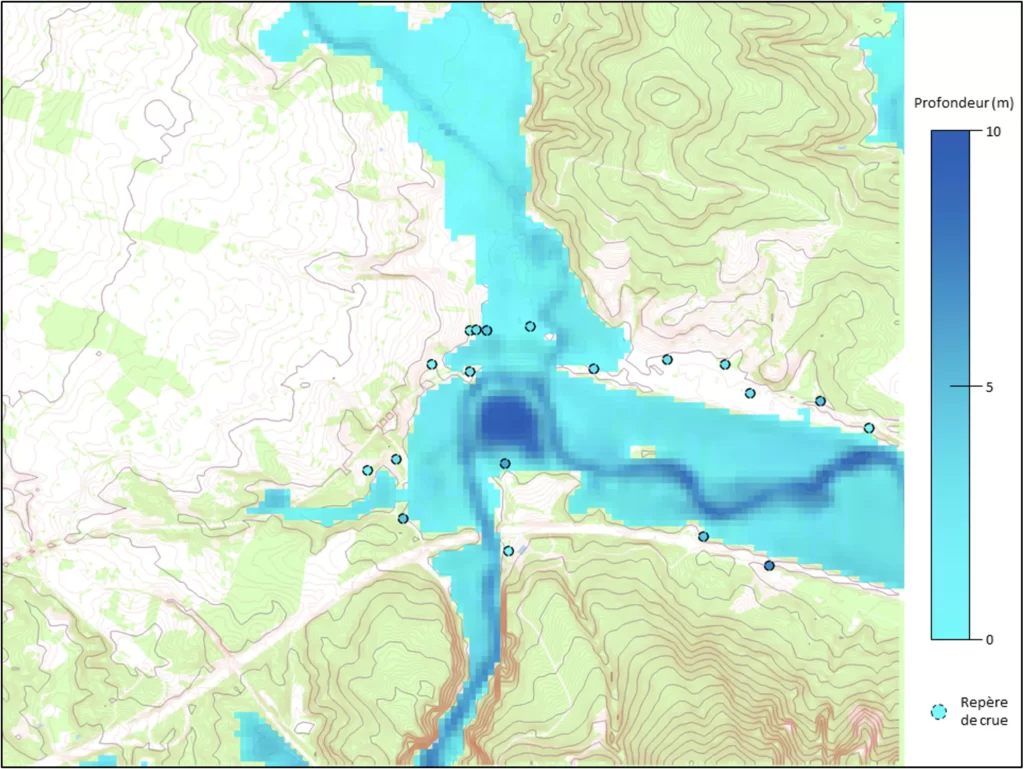
A flood mapping model is a digital tool to simulate the spatial extent of a flood zone on a territory. This model is essential for assessing vulnerability to flood risk. They can be used for:
- Preventively, to identify areas with a high-level risk and to propose a framework for land-use planning for reducing flood risk (sizing of structures, urban planning).
- In real time, to improve flood risk crisis management (alerts, evacuations). In the long term, with future flood risk scenarios incorporating climate change for better planning and investment guidance.
Depending on the models used, the maps characterize the risk of flooding due to river overflow and/or rainwater runoff.
All flood mapping methods require the use of a digital terrain model (DTM). In many cases, their effectiveness depends on the quality of the input data, particularly the DTMs. In addition, there are several types of flood mapping models, each with their own advantages and disadvantages, depending on the conditions of use and specifications. At Hydroclimat, we offer a combination of flood models based on different approaches to meet all our customers’ needs.

There are two types of flood mapping models: physically based and simplified conceptual hydraulic models.
Physical hydraulic models solve the physical equations of hydrodynamics to compute water height and velocity at each point. They have the advantage of respecting physics to a greater or lesser degree, according to clearly established assumptions. The most complex physics-based hydraulic models produce highly realistic simulations, but are very computationally intensive, which limits their operational usefulness. These models offer a range of approaches to solving the physical equations, from the simplest (1D steady-state equations) to the most complex (2D shallow water equations through to 3D Navier-Stokes equations).
Other models are based on alternative approaches to flood mapping, such as water intersection models based on the empirical Manning-Strickler equation, conceptual cellular automata models, and data-driven statistical models. These models have in common to be less computationally intensive than the physically based hydraulic models. They are therefore favored for large-scale mapping or real-time flood risk forecasting.
Model type | Strength | Limitation | Suitability | Examples |
|---|---|---|---|---|
Hydrodynamic models | Direct linkage to hydrology
Detailed flood risk mapping
Can account for hydraulic features
Quantity Timing and duration of inundation with high accuracy | Computationally intensive
High data requirements
| Local flood risk assessment
Hydraulic feature dimensioning
Erosion risk assessment
| HEC-RAS 1D
HEC-RAS 2D
LISFLOOD-FP
|
Simplified conceptual models | Computtionally efficient | No/little flow dynamics representation
No inertia terms (not suitable for rapidly varying flows)
| Large-scale flood risk assessment
Uncertainty analysis
Real-time forecasting
| MHYST
CAflood
|
Tableau 1. Comparative table of flood mapping approaches. Inspired by Teng et al. (2017). Example models shown are used within Hydroclimat.
Each hydraulic model has its own strengths and weaknesses and responds to a specific field of use and specifications to obtain the best performance.
The performance of a flood mapping model refers to the model’s efficiency in reproducing the characteristics of a flood (flooded area, water heights, velocities, and dynamics). The efficiency of a flood model is measured with observed flood data, which can come from multiple sources, and depends on the type of model used. Physically based hydraulic models are often more efficient than empirical models, but costly in computation time even on high-performance computing servers.
As a result, the efficiency of an operational hydraulic model is constrained by its runtime This is particularly the case when simulations are carried out over a large area (> > 100 km²), repeated many times (for real-time forecasts or prospective scenarios), or when the flow situations modeled are spatially very heterogeneous or highly unsteady (complex terrain, levee failures). The computational speed of a flood model is often a quality as much appreciated as its efficiency.
At Hydroclimat, we have opted to use innovative AI-based hydraulic models for their efficiency of execution. We also operate a range of hydraulic models of varying complexity to suit our customers’ needs.
The performance of a flood mapping model is a measure of its ability to reliably reproduce the flooded area during a flood event, and if necessary, the flood dynamics, i.e., the evolution of water levels and flow velocities. The performance of a flood model can be assessed using direct and/or indirect approaches.
Direct approaches quantitatively evaluate a simulation by comparing the variables calculated by a flood model with observations, in most cases water levels. These measurements are made in the field after a flood event (high water marks) or with permanent water level measuring stations (only in riverbeds). Satellite data can be used to map flooded areas in a given territory (known as pseudo-observations), but require the satellite to pass over the area at the time of the flood.

Indirect approaches use qualitative data related to flooding. This data comes from post-disaster damage reports (destruction photos, damage declarations), and from the crisis management unit set up by the authorities during the flooding episode (distress calls, traffic restrictions). Some AI algorithms process these publications on social networks. Overall, this information is less qualified than direct measurements.