The new ScenarioMIP pathways are reshaping the range of climate futures to be explored throughout the 21st century, from the Very Low scenario to the High scenario.
The new CMIP7 scenarios have just been quantified. The publication of the new ScenarioMIP pathways significantly changes our representation of the climate futures to be explored. The upper end of the range has been revised substantially downward compared with SSP5-8.5, while pathways capable of sustainably limiting warming to +1.5°C are also becoming more difficult to achieve.
It would therefore be misleading to conclude that “CMIP7 projects less warming than CMIP6”. Above all, CMIP7 updates the range of emissions pathways considered relevant for exploring the 21st century.
And the temperatures presented today are not yet those produced by the new CMIP7 climate models. They are derived from the new emissions pathways using the reduced-complexity climate model FaIR v2.2.
The next step will be crucial: observing how CMIP7 models translate these pathways into changes in temperatures, precipitation, winds and climate extremes, and then regionalising these changes to characterise hazards at the scale of territories and assets. For adaptation, knowing the global pathway is not enough.
The operational question remains the same: what does this pathway actually change where we live, build and invest?
Based on ScenarioMIP, Van Vuuren et al., 2026 and Carbon Brief.e
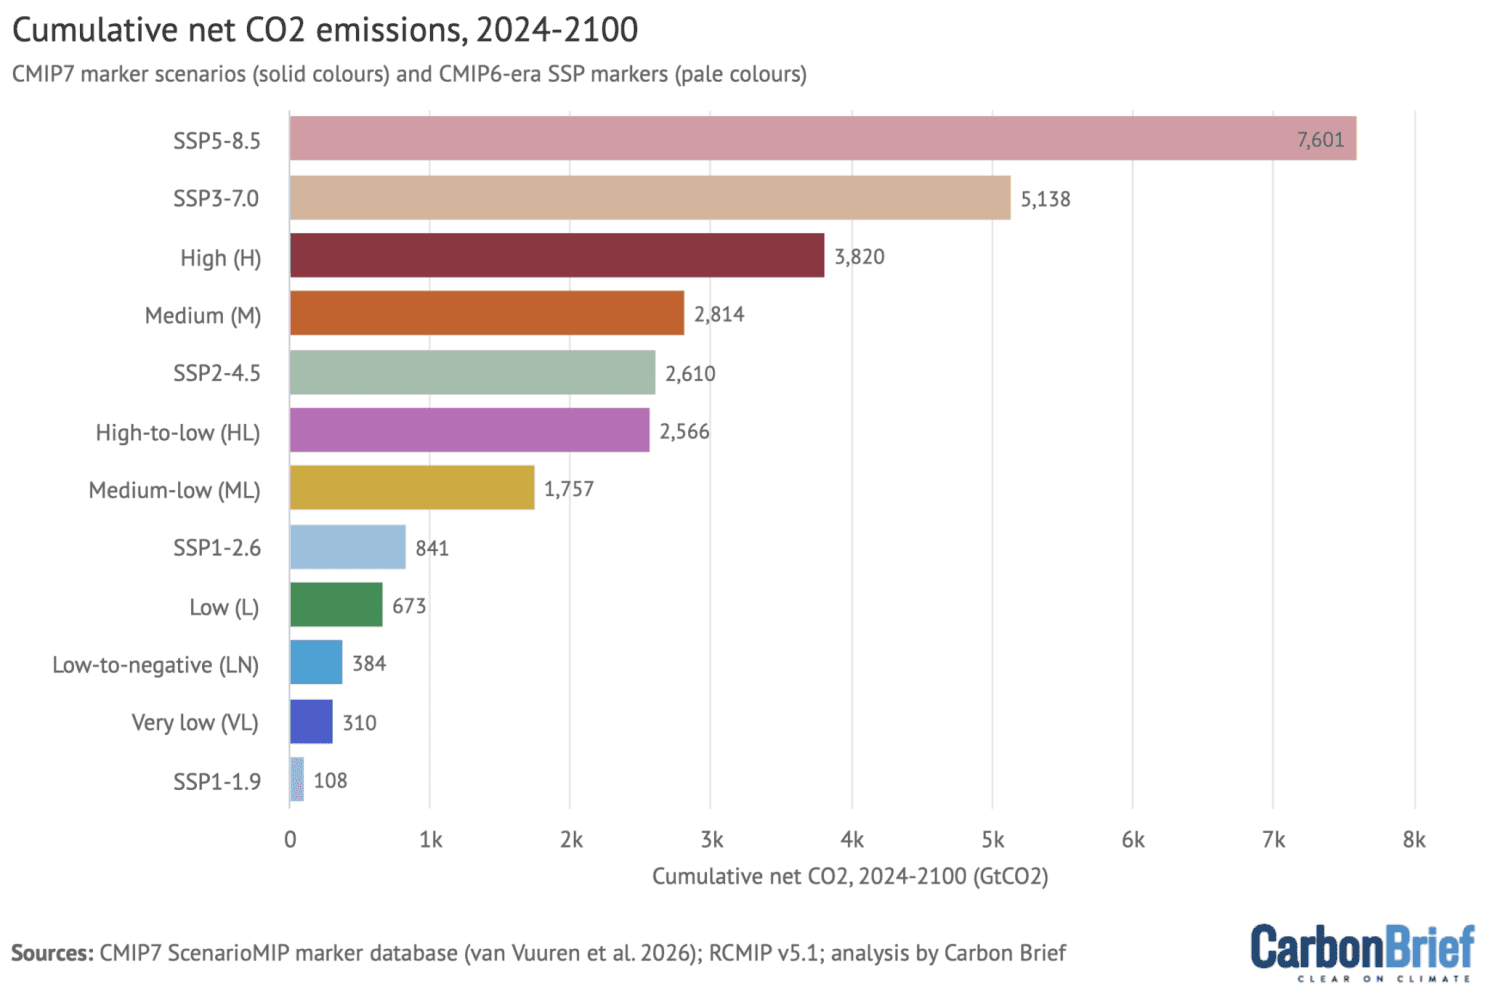
This is the most visible change. The difference is even more pronounced when looking at cumulative emissions. Between 2024 and 2100, the High scenario represents around 3,820 GtCO₂, compared with 7,601 GtCO₂ for SSP5-8.5. CMIP7’s highest scenario therefore represents roughly half the cumulative emissions of its CMIP6 counterpart.

FIGURE 2: Cumulative net CO₂ emissions, 2024–2100. Source: ScenarioMIP, RCMIP v5.1 and Carbon Brief analysis.
This evolution notably reflects the changes that have taken place in the global energy system since CMIP6 was developed. The expansion of renewable energy, the decline in its cost and the climate policies already implemented make pathways based on very strong growth in fossil fuel use less plausible today.
This narrowing therefore does not result from a revision of climate physics, but from an update of the futures considered plausible. Future pathways are also better constrained by the emissions trends observed over recent years. In this context, scenarios based on extremely strong growth in fossil fuel use, such as SSP5-8.5, now appear less plausible than when CMIP6 was developed.
This change even marks a break with several generations of climate scenarios. For CMIP7’s highest scenario, median warming in 2100 is estimated at around +3.3°C.

FIGURE 4 – Warming in 2100 under the highest scenario from each model generation. Based on Van Vuuren et al., 2026 and Carbon Brief analysis.
This is where interpretation becomes important. +3.3°C is a median value, not an upper limit for warming. Under the High scenario, the estimated range in 2100 extends from around +2.6°C to +4.4°C.
The High scenario therefore does not represent the maximum possible warming, but rather the highest-emissions pathway retained in CMIP7 to explore plausible futures.
More importantly, the narrowing also affects the lower end of the range. The Very Low scenario reaches around +1.6°C in 2100, but only after peaking at close to +1.8°C around mid-century. Even this pathway therefore now implies a temporary overshoot of +1.5°C.
Global emissions have not fallen as quickly as in the most ambitious pathways developed for CMIP6. Between 2024 and 2100, the Very Low scenario represents around 310 GtCO₂ of cumulative emissions, compared with only 108 GtCO₂ for SSP1-1.9.
CMIP7 therefore narrows the range of climate futures at both ends: extremely high-emissions pathways are becoming less plausible, while avoiding an overshoot of +1.5°C is also becoming more difficult. In other words, CMIP7 updates both ends of the range based on the situation observed in the mid-2020s.
The seven CMIP7 scenarios currently result in median warming estimates ranging from around +1.6°C to +3.3°C by 2100.
The Medium scenario, which extends the climate policies implemented as of 2025, reaches around +2.9°C by 2100. It serves as a reference pathway, not as a prediction of the most likely future. Like the other CMIP7 pathways, it is designed to explore a possible future based on a given set of assumptions. Its uncertainty range remains wide: around +2.2°C to +3.9°C.

FIGURE 6 – Warming in 2100 under the new CMIP7 scenarios and the previous CMIP6 scenarios. Source: FaIR v2.2, ScenarioMIP, RCMIP v5.1 and Carbon Brief analysis.
A global warming level of +2.9°C does not mean a uniform increase of +2.9°C everywhere. This value does not tell us how many days above 40°C a city will experience, how extreme rainfall will evolve at an industrial site, or how droughts, river flows or flooding will change across a given region.
The climate scenario therefore provides the global framework. It does not yet characterise the climate hazard to which an asset or region will be exposed. Climate risk can only be analysed once this hazard is combined with exposure and vulnerability.
This is a key distinction in climate risk analysis. A global pathway still needs to be translated by climate models, regionalised, and then converted into indicators tailored to local challenges.
The climate pathway therefore defines a global framework. On its own, it is not enough to characterise the hazard to which a region or asset will be exposed.
The CMIP7 pathways in which temperatures decline rely on massive amounts of CO₂ removal. Between 2024 and 2150, cumulative removals reach around 655 GtCO₂ in Very Low, 1,356 GtCO₂ in Low and as much as 2,358 GtCO₂ in Low-to-Negative. For the latter scenario, this represents around 60 years of current global emissions that would need to be removed from the atmosphere.

FIGURE 8 – How much CO₂ the scenarios remove from the atmosphere. Source: CMIP7 ScenarioMIP marker database, Van Vuuren et al. 2026, FLEX and Carbon Brief analysis.
These pathways therefore rely not only on rapid emissions reductions. They also assume a massive scale-up of CO₂ removal capacity, with some technologies still far from the levels envisioned in these scenarios today.
The publication of these new data therefore provides a more precise understanding of CMIP7. The highest scenario is significantly less extreme than SSP5-8.5, but the lowest pathways are also becoming more difficult to achieve.
It would therefore be misleading to summarise these results by saying that “CMIP7 projects less warming than CMIP6”. CMIP7 narrows the range of climate futures. It does not eliminate uncertainty, high levels of warming or the associated risks.
At this stage, these figures remain estimates produced using FaIR v2.2; simulations from the CMIP7 climate models are still awaited.
The next step will be to translate these pathways into regional changes in temperatures, precipitation, winds and climate extremes, and then into concrete impacts at the scale of territories and assets. Because for adaptation, the key question remains the same: what does this pathway actually change where we live, build and invest?
ScenarioMIP – CMIP7 Scenario Explorer
Van Vuuren et al. (2026) – ScenarioMIP-CMIP7, Geoscientific Model Development
Carbon Brief – Explainer: The CMIP7 emissions scenarios and how they explore future climate change
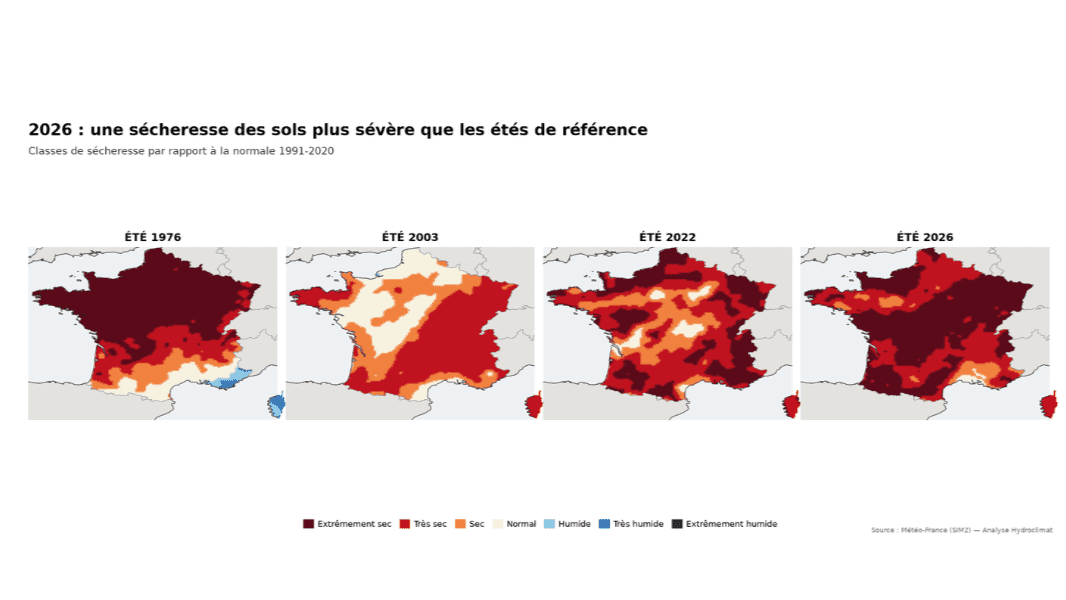
Soil drought: where does summer 2026 really stand?
9/10/2026
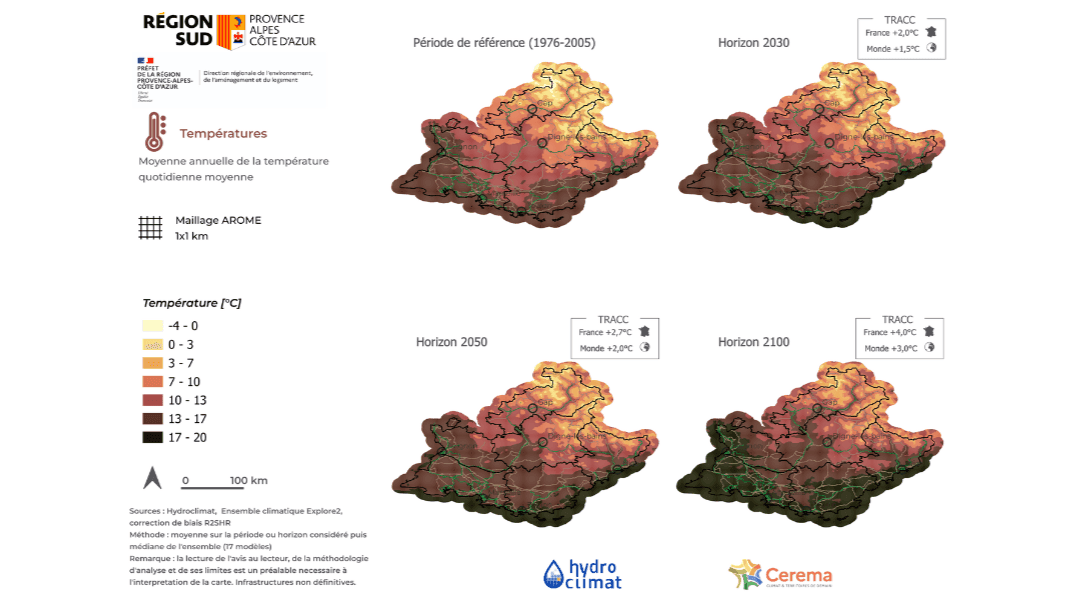
Adapting Regional Transport Networks to Climate Change: From Assessment to Action
9/3/2026
Data center: integrating future climate into site selection
8/24/2026
How much will climate risk really cost?
6/29/2026
Global scoring: turning climate data into decision-support indicators
6/22/2026
